

前言
前几天写了一篇Laradock-部署本地开发环境,使用了几天发现确实很方便。最近又折腾点东西,没有XDebug确实不顺手,网上找了不少资料和教程,有些坑和解决方案记录一下。
开搞
开启XDebug
需要laradock容器php-fpm、workspace都安装XDebug,如果已经安装则不需要管它,否则需要修改你的laradock目录\.env。
PHP_FPM_INSTALL_XDEBUG=true
WORKSPACE_INSTALL_XDEBUG=true
PHP_IDE_CONFIG=serverName=laradockPHP_IDE_CONFIGXDebug服务名看你自己,你想改就改,不想改默认就行。
然后再重新build docker-compose build php-fpm workspace。每次build真心漫长,就一个扩展也要整个编译,这里不得不吐槽下。强烈建议科学上网或者修改laradock源地址(修改源地址我没有验证过,不会科学上网你可以试试):
# If you need to change the sources (i.e. to China), set CHANGE_SOURCE to true
CHANGE_SOURCE=true
# Set CHANGE_SOURCE and UBUNTU_SOURCE option if you want to change the Ubuntu system sources.list file.
UBUNTU_SOURCE=aliyun
配置xdebug.ini
两处都要修改你的laradock目录\workspace\xdebug.ini、你的laradock目录\php-fpm\xdebug.ini:
//xdebug.remote_host="docker.for.win.host.internal"
xdebug.remote_connect_back=1
xdebug.remote_port=9000
xdebug.idekey=PHPSTORM

xdebug.remote_autostart=0
xdebug.remote_enable=0
xdebug.cli_color=0
xdebug.profiler_enable=0
xdebug.profiler_output_dir="~/xdebug/phpstorm/tmp/profiling"

xdebug.remote_handler=dbgp
xdebug.remote_mode=req

xdebug.var_display_max_children=-1
xdebug.var_display_max_data=-1
xdebug.var_display_max_depth=-1
两种方法:
- 修改
xdebug.remote_host值为Windows:docker.for.win.host.internal,MacOS:docker.for.mac.host.internal。xdebug.remote_connect_back修改为0。 - 注释掉
xdebug.remote_host配置,不指定主机xdebug.remote_connect_back=1,让XDebug自动捕获主机。
网上很多教程说是改成xdebug.remote_host=docker.for.win.localhost或者xdebug.remote_host=docker.for.mac.localhost,这是之前的写法,巨坑。直接使用第二种方法省得坑爹。
默认xdebug.ini配置文件是不能动态修改的,每次修改都必须build,为了方便可以修改docker-compose.yml文件
### Workspace Utilities ##################################
    workspace:
      build:
        context: ./workspace
        args:
          ...
      volumes:
        ...
        - ./workspace/xdebug.ini:/etc/php/${PHP_VERSION}/cli/conf.d/xdebug.ini ###添加磁盘挂载
### PHP-FPM ##############################################
    php-fpm:
      build:
        context: ./php-fpm
        args:
        ...
      volumes:
        ...
        - ./php-fpm/xdebug.ini:/usr/local/etc/php/conf.d/xdebug.ini ###添加磁盘挂载
...这样修改后可以热修改文件,就像配置nginx站点一样方便
配置PHPStorm
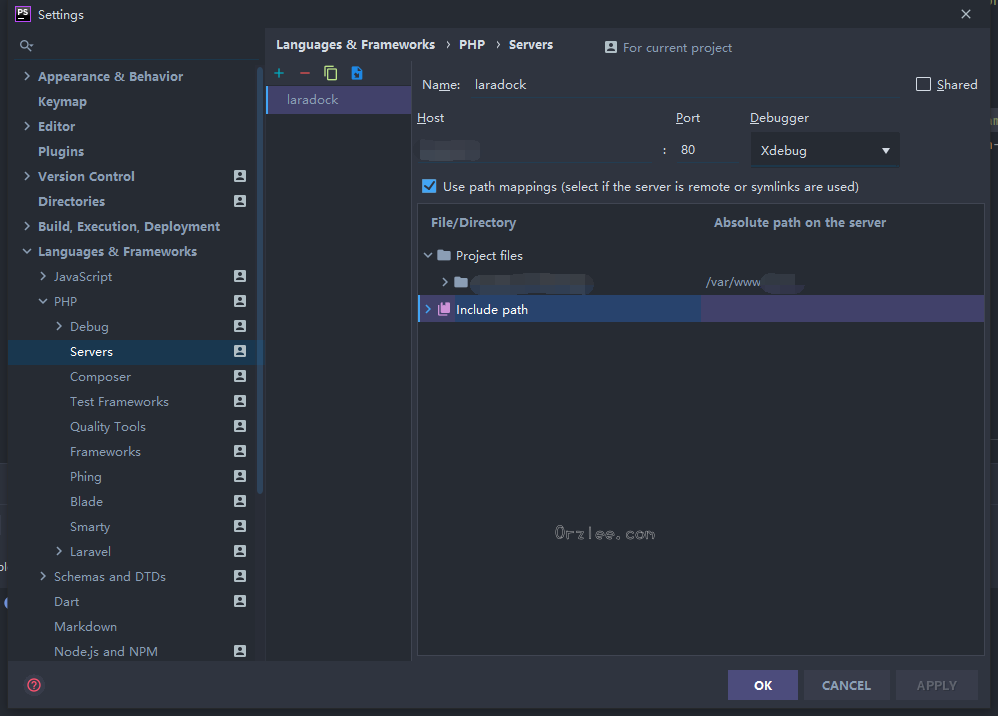
新建一个服务,服务名称就是这里配置的PHP_IDE_CONFIG=serverName=laradock laradock,Host填写你本地站点访问地址,开启Use path mappings,填写你的映射地址/var/www/you-project,然后OK。
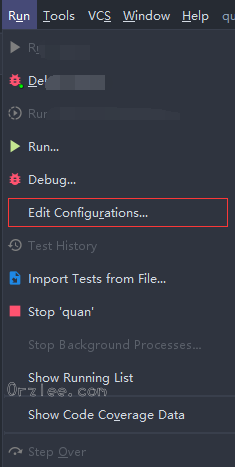
点击Run菜单:
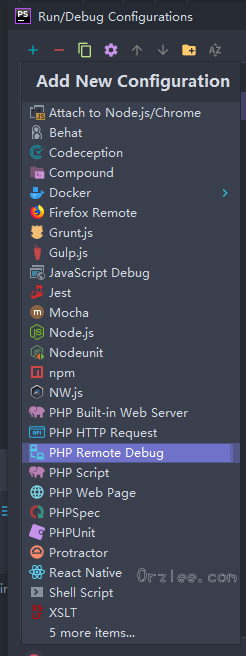
点击+添加一个PHP Remote Debug:
勾选Filter debug connection by IDE key,选择你的刚刚添加的Server,IDE key填写PHPSTORM,这个值是在xdebug.ini配置的。
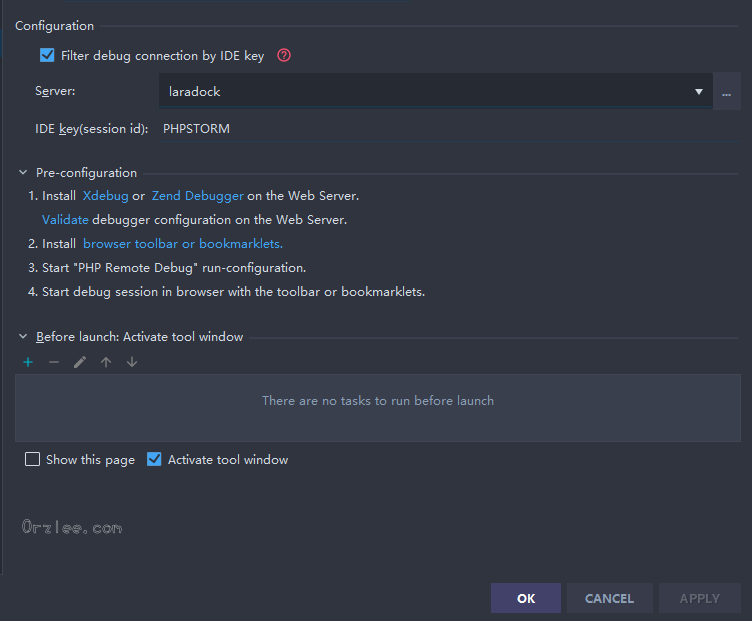
再点击run, Debug 'xxx'就可以调试了。
我在调试的时候发现PHPStorm时不时断点,提示错误:Remote file path '/var/www/xxxxx artisan' is not mapped to any file path in project,这是因为XDebug也会调试php cli,如果不需要可以关掉:
- 进入
workspace容器docker-compose exec workspace bash。 - 编辑
cli的xdebug.ini,nano /etc/php/7.4/cli/conf.d/xdebug.ini,注意你自己的PHP版本,修改两项配置:xdebug.remote_autostart=0 xdebug.remote_enable=0保存退出就好了,不会再调试
php cli了。需要的时候再打开好了。
配置后所有laradock容器中的站点全部都有效。你可以试着访问容器中其他站点,当前项目也会进入调试模式,而且PHPStorm又出现错误:Remote file path '/var/www/xxxxx' is not mapped to any file path in project。因为当前目录映射找不到。要重新打开其他项目,配置下目录映射,然后再开启动调试,不要开多个PHPStorm一起调试,会疯掉的。
结语
在这里浪费不少时间,确实够折腾的,不过确实长记性了,最近又开始折腾Laravel nova,2018年刚出的时候确实很多不完善,一直使用Laravel admin,总得来说还是没有Laravel nova那么舒服。现在Laravel nova经过那么长时间过度已经很完善了,是时候使用Laravel nova继续折腾了。


评论 (0)